
How to understand a hurricane forecast
Measuring hurricane risks — and understanding what those risks mean for the public — is complicated. Here’s a place to start.
This article was updated on August 26, 2021, to reflect the final results of the 2020 Atlantic hurricane season.
The 2020 hurricane season was a busy one.
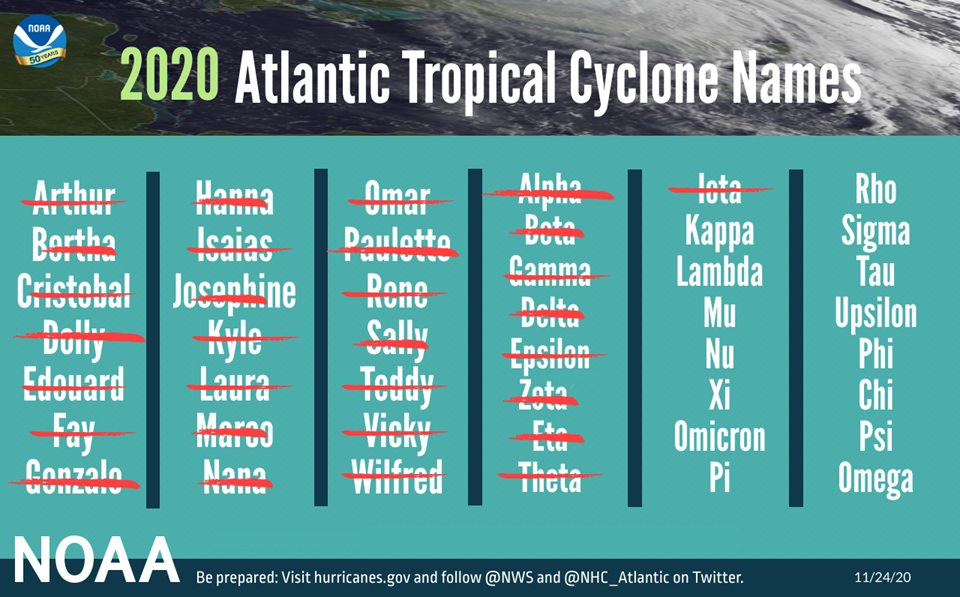
On Aug. 6, 2020, the National Oceanic and Atmospheric Administration’s Climate Prediction Center updated its earlier hurricane season forecast from 13 to 19 named storms to 19 to 25 named storms, including the storms already named this season. Twenty-one storm names were selected in advance of the season by the World Meteorological Organization. The 2020 Atlantic hurricane season ended up having a record-breaking 30 storms, and meteorologists had to resort to naming storms using the Greek alphabet for the second time in history.
With more storms, more people are tuning in to understand their hurricane risk — but many people struggle with understanding hurricane measurements and what they mean for hurricane preparation.
By the numbers
Measuring where hurricanes will go and how they will behave is complicated.
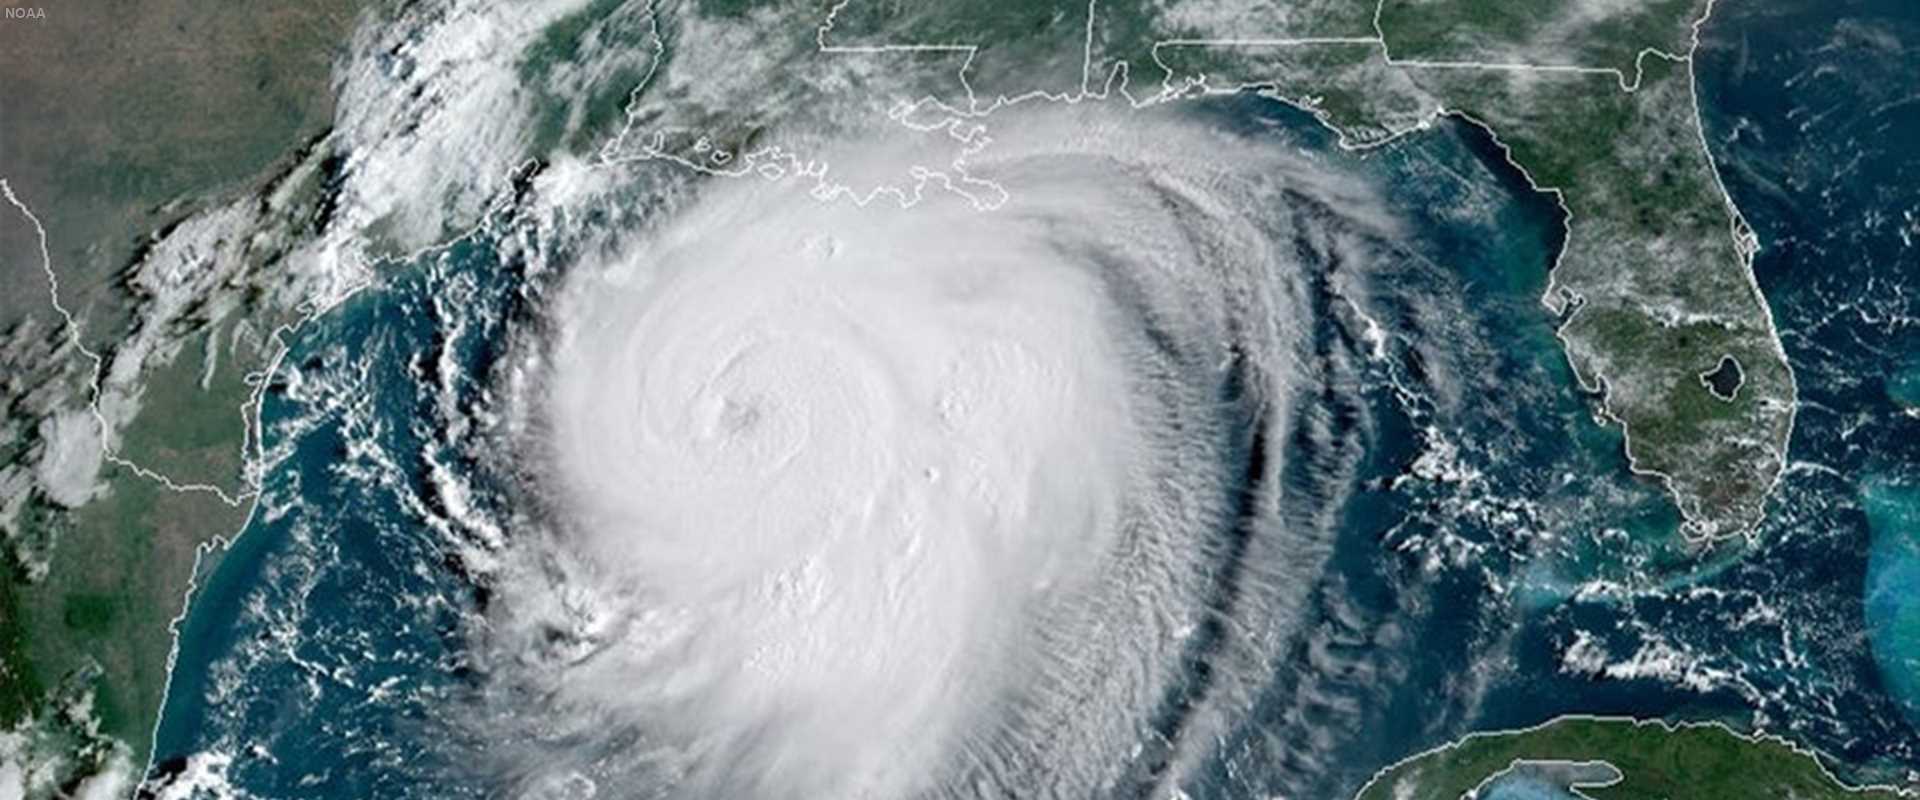
Hurricanes are categorized by their sustained wind speed, ranging from below 74 miles per hour for tropical storms to above 157 miles per hour for Category 5 storms. August 2020's Hurricane Laura was the fastest-intensifying storm in a decade, speeding up by 65 miles per hour over 24 hours. When it came ashore as a Category 4 storm, it had 150-miles-per-hour sustained winds, about the speed of a commercial plane taking off.
Though sustained wind speed determines hurricane category, it’s only one of many ways to measure a hurricane, said Bill Read, former director of the National Hurricane Center. Wind speed works in tandem with the hurricane’s track, size, storm surge and rainfall to determine the relative danger of the storm.
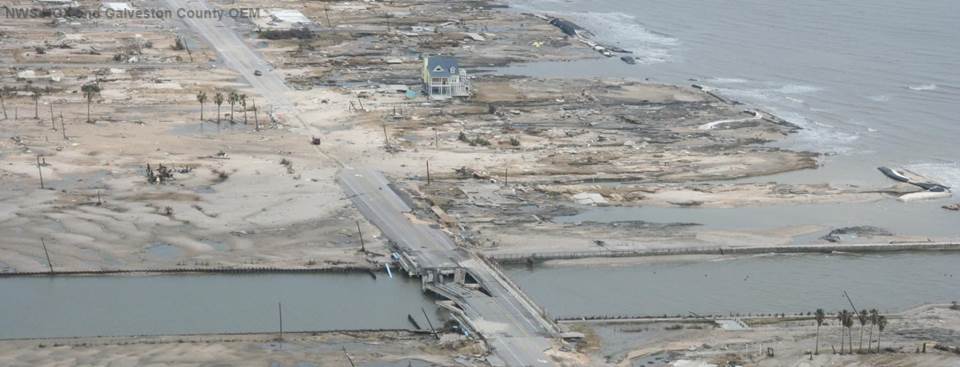
Read gave the example of Hurricane Ike, which made landfall in Galveston in 2008 as a Category 2 storm with sustained winds of 110 miles per hour. Because of Hurricane Ike’s massive size, it covered more ground for a longer time, making it particularly dangerous despite its relatively low category.
As with Hurricane Ike, it is water — not wind — that presents the greater risk, said Douglas Wunneburger, Ph.D., mapping lead for Texas A&M University’s Hazard Reduction and Recovery Center and instructional professor in the Texas A&M Department of Landscape Architecture and Urban Planning.
“It doesn't matter how much plywood you put up to protect your windows, it's not going to work if it's storm surge that gets to you instead of just wind,” he said.
Storm surge — water pushed onshore by a storm — is affected by the speed and angle of the storm’s approach as well as by its size. Bathymetry, or underwater topography, is also “a real big wildcard” in storm surge, Read said.
Though Hurricane Ike was a Category 2 storm when it hit Texas and Louisiana, the storm’s size and the local bathymetry contributed to it having up to a 20-feet-high storm surge.
“If you ran the exact same meteorological storm as Ike inland near West Palm Beach, Florida, you would get about seven feet of storm surge,” Read said. “It's so flat and gently sloped in Texas and Louisiana that the surge will penetrate far inland, whereas it's kind of like a bluff there on the east coast of Florida that stops the penetration, plus the very steep slope of the sea floor just offshore.”
Both storm surge and rainfall can cause flooding, but rainfall is also difficult to predict.
“The quantitative precipitation forecast on any given day is a challenge. The convective nature of the rains in a tropical cyclone are on a scale usually not amenable to accurate forecasts many days in advance,” Read said. Like storm surge, the impact of rainfall is “highly dependent on the track of the storm and where the heaviest rain bands are going to set up,” he said.
Translating the numbers to the public
When people flip to their local TV stations to learn about impending hurricanes, often the first thing they see is the graphic nicknamed the “cone of uncertainty,” a tadpole-shaped blob extending from the storm’s current location toward where the storm might go in the coming days.
The public often misinterprets the cone of uncertainty. This is understandable, since the cone of uncertainty is part of a prediction model, something that is not common in day-to-day life, but misinterpretations can be dangerous.
Sometimes the cone is interpreted as meaning that the hurricane is getting bigger over time, or that it represents all areas that will be impacted. Neither interpretation is correct — but they can erroneously lead people to feel less threatened and prepare less if they are farther from the midline of the cone.
Instead, the cone of uncertainty shows a range of possible paths for the center of the storm for up to the next five days.
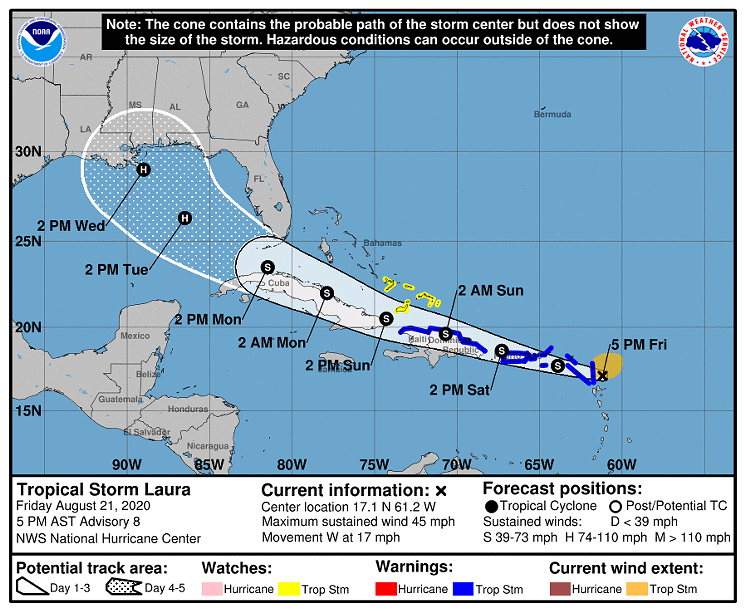
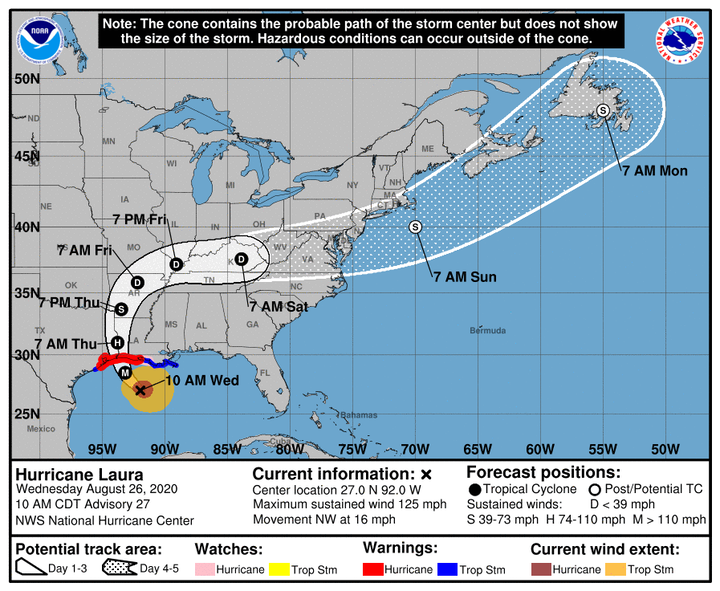
The cone is created using points that show the likely location of the storm’s center. Each point is surrounded by a circle representing the uncertainty of the point. The radius of each circle is based on the average error of the past five years’ forecasts, or how accurate — or not — the forecasts were.
“For each storm, we do a painstaking reanalysis of all the data. We check all the observations that we got after the storm actually occurred, make any corrections to that track and use that best track to calculate the errors,” Read said.
The cone is then drawn by connecting those uncertainty circles together. More uncertainty farther in the future means that the circles get larger and larger as they get farther out in time, showing a broader range of possible paths for the center of the storm. There’s a two out of three chance that the center of the storm will be within the cone.
Because the cone shows the possible paths of only the center of the storm, extreme weather can still happen outside of the cone, so people living on the edge of and near the cone should also be prepared. The storm could move slightly, as represented by the uncertainty circles, potentially changing where the storm makes landfall and what its impacts are. As the cone map itself is static, the National Hurricane Center releases updated maps at least every six hours as the storm’s path changes.
While the information shown in the cone of uncertainty is important, “it’s not the total picture,” Read said. The cone doesn’t show the size of the storm, and — like the storm’s category — the cone doesn’t indicate anything about rain or storm surge.
“There's no way one graphic will cover all the vagaries of a hurricane,” he said. “I would use the cone graphic as a starting point.”
Storm surge maps help pick up where the cone of uncertainty leaves off. Like the cone of uncertainty, storm surge maps show a range of possible scenarios. Also like the cone of uncertainty, storm surge maps can sometimes be difficult to interpret.
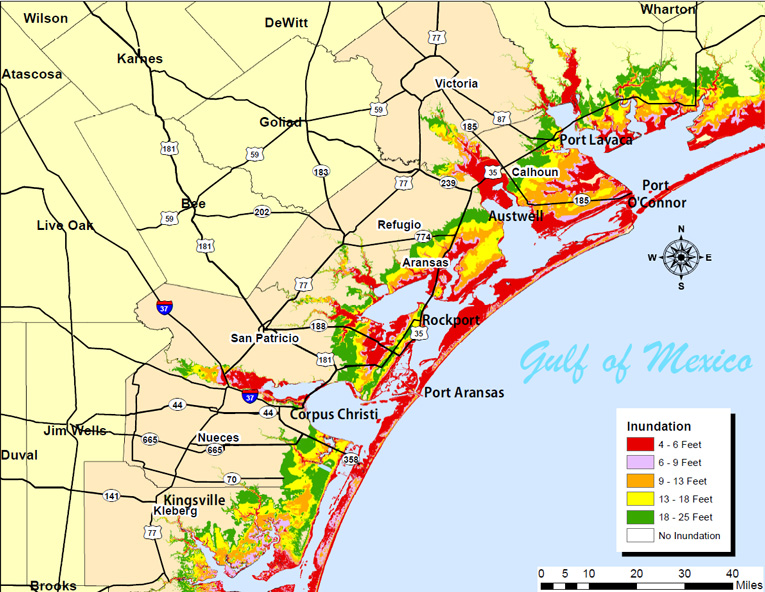
Storm surge models are created by running scenarios with storms coming from different angles and points of origin for each storm category. All those different possible scenarios are combined, showing all the possible worst-case scenarios at once. The associated storm surge maps for individual storms show where flooding could happen, with color coding for the how high the water could get in different areas.
But not every area will end up getting the worst-case scenario, Wunneburger of the Hazard Reduction and Recovery Center said.
“Pick one county, 50 miles of coastline. There’s not a storm that's going to have the maximum impact for a 50-mile wide direct hit. It's always going to be a gradient,” he said.
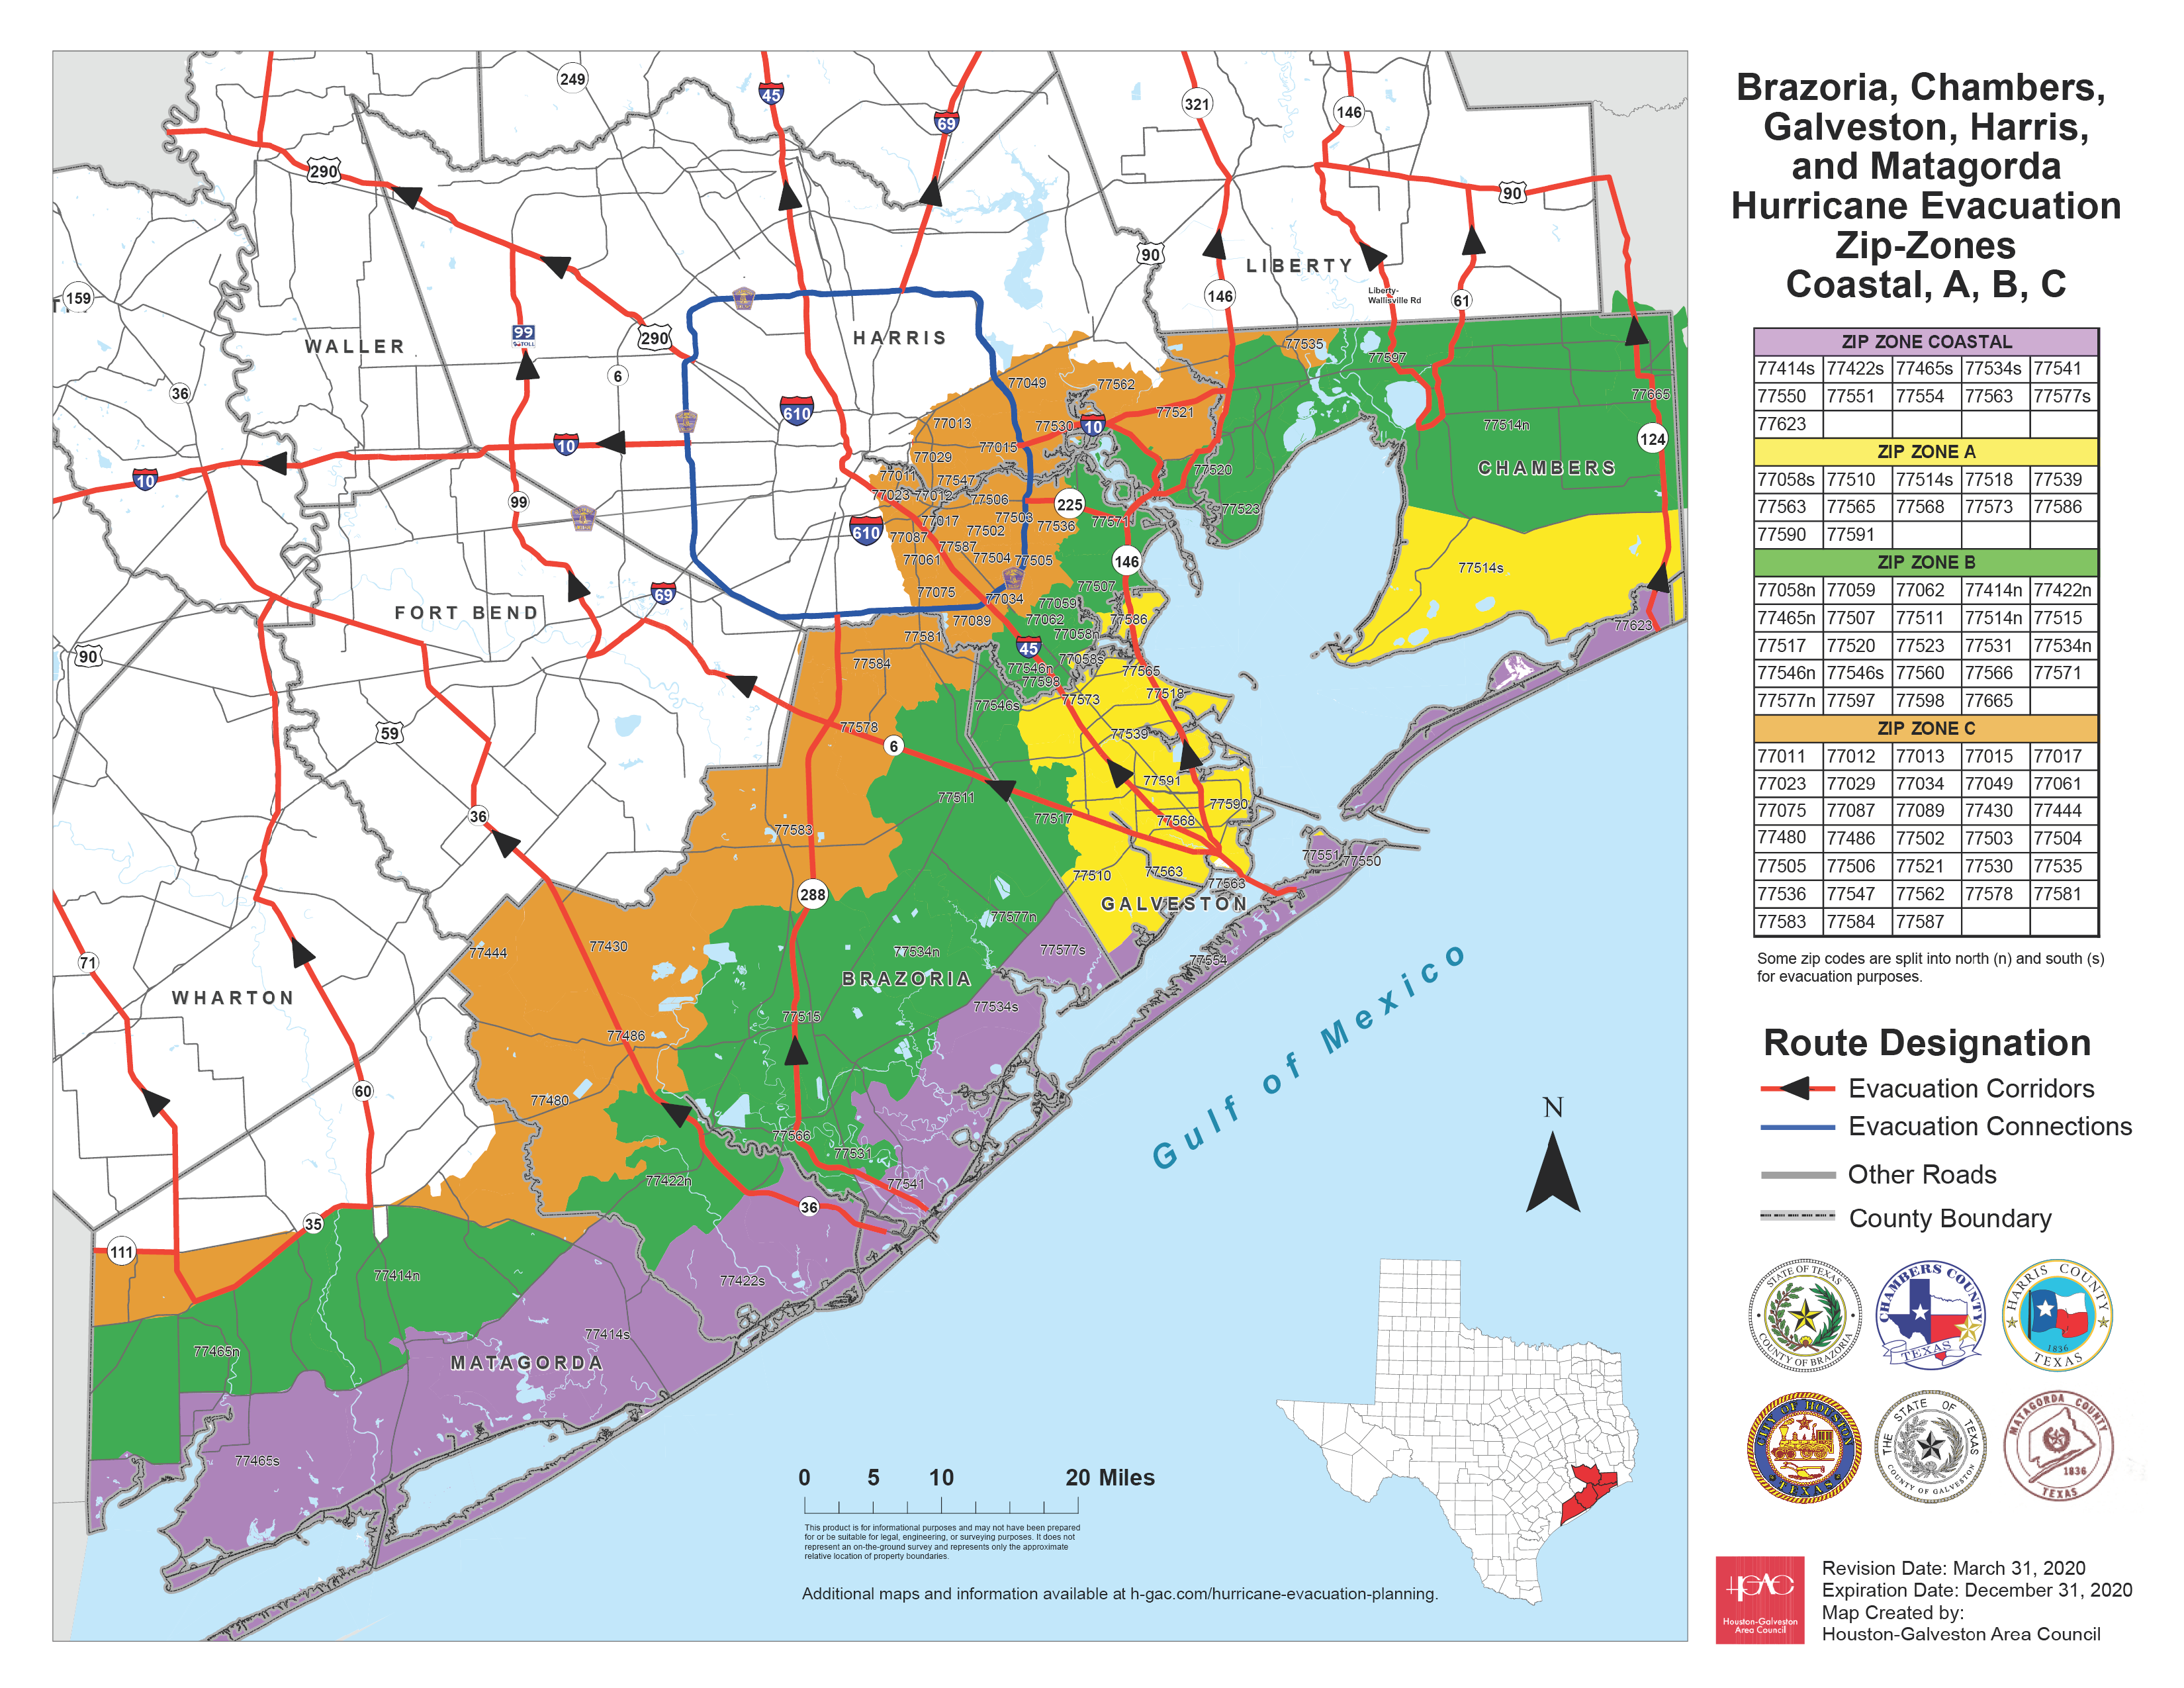
To translate all that hurricane risk information into something locally actionable, meteorologists and emergency managers work together to develop and implement maps of evacuation zones. Clarity is particularly important when it comes to evacuation zone maps, Wunneburger said.
“We want to be able to communicate the zone boundaries through a radio message or text or some sort of an advisory. So it can't be that detailed,” he said. “There’s that kind of juggling act we have to work with.”
A picture worth a thousand words?
At the root of the struggle to convey hurricane risk information is a larger issue: visually communicating any risk, from a hurricane to a pandemic, is difficult. Juggling colors, patterns, terminology and more adds a layer of complication to already-complex concepts.
While maps with a continuous color gradient can show more nuanced information, maps with a smaller number of discrete colors — like evacuation maps — can be easier to understand quickly. Certain colors have cognitive and cultural associations, such as red for danger, Read said, which can cause confusion when colors are used in different ways.
Patterns also have common associations, as Read found in some maps of the cone of uncertainty. Beyond 72 hours out, the cone of uncertainty changes from a solid color to hashing to represent the decreased certainty that far out.
In a study, Read learned that most people thought the hashing was raindrops, and it was going to turn into a rainstorm. “Almost nobody got the interpretation intended,” Read said. “It was frustrating.”
To combat these issues, Wunneburger said most people try to stick with established practice, as he did for the Hazard Reduction and Recovery Center’s Coastal Bend Hurricane Evacuation Study Planning Atlas. When he mapped out the area’s social vulnerability index to identify areas that may require supplementary assistance in preparation for or recovery from a storm event, he used the same colors used by the U.S. Centers for Disease Control and Prevention.
Where established practice isn’t enough, social science research, community input and new technology are improving maps even more. Focus groups have helped the National Hurricane Center tweak its maps, while new tools like the Center for Texas Beaches and Shores’ Buyers Be-Where tool help people understand their property’s relative risk from hurricanes, flooding and more.
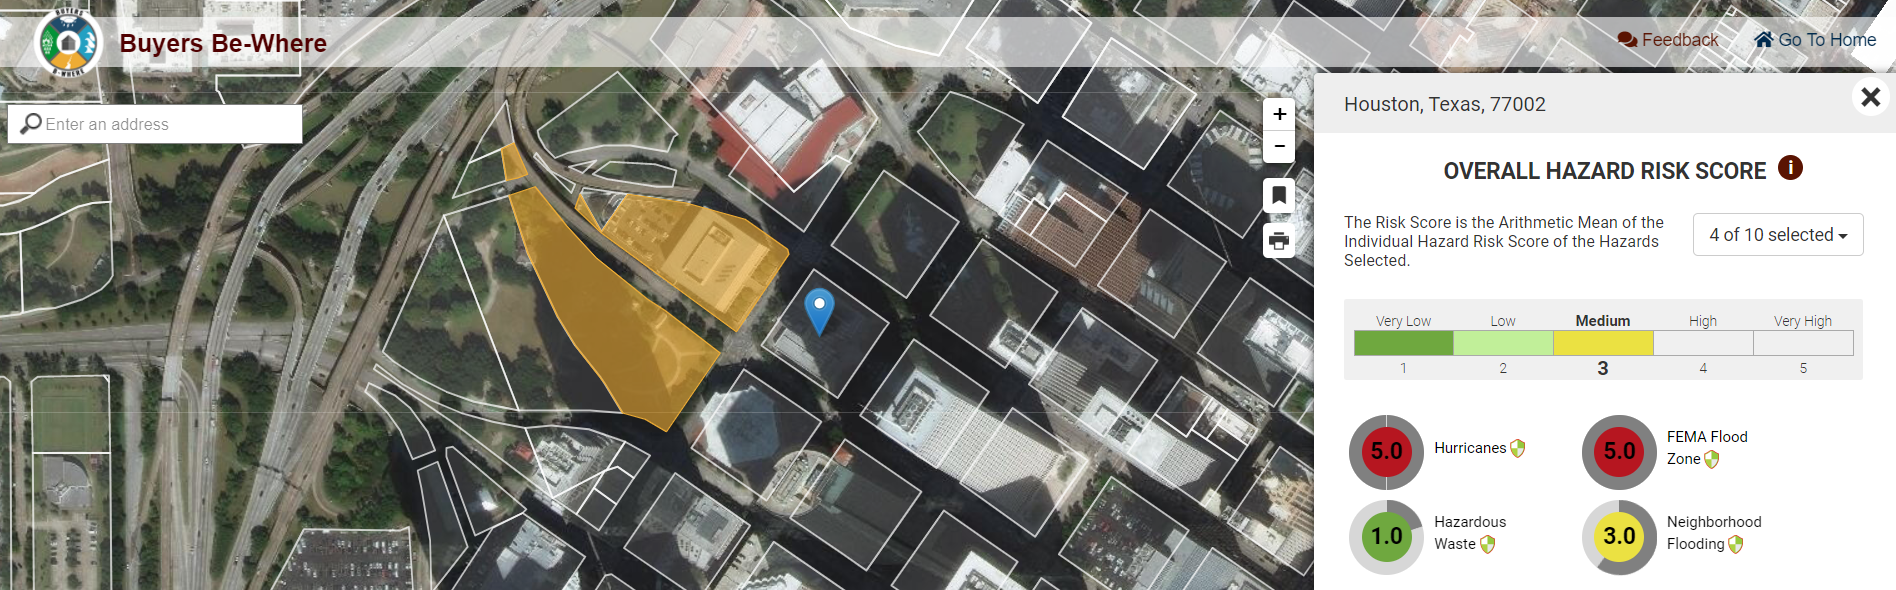
“I think the combination of the social science and proven technology for creating and disseminating this information will lead to pretty darn good improvement,” Read said.
Preparation starts earlier
Even with all the improvements, to be truly prepared for a hurricane, Read said it’s not enough to just know how to interpret the cone of uncertainty or a storm surge map in the days before the hurricane hits.
First, people need to know their baseline risk level.
“At what level will their house start coming apart at the seams? How much rain will it take to flood? If they don't know those factors to begin with, then it's extremely difficult, because they don't have a baseline to base their decisions on,” he said.
Once that risk baseline is established, “it behooves you to become an amateur weatherman,” he said.
“Weather affects everything you do every day. Check the forecast first thing in the morning and then right before you go to bed. Then if there's something on the horizon, you're going to say, ‘wow, that's where hurricanes form,’ and maybe check more often to see if this threat is going to become real.”
If people learn their baseline risk and cultivate an awareness of the weather, then they will be more primed for hurricane preparedness, he said.
Nearly half of an already-historic hurricane season is still ahead. As the Earth gets hotter, storms are getting wetter and intensifying faster, and strong storms are getting stronger. Understanding hurricane risks in advance is only getting more important.
“If you’ve got a giant pine tree in your yard at the time the hurricane comes in and it blows over and cuts your house in half, there's nothing you could have done other than cut that tree down months ago. You only mitigate that so much at the last minute,” Read said. “You need to learn all your risk factors before there's ever a cloud in the sky.”
Explore this Issue
Authors

As a communications specialist for Texas Water Resources Institute, Chantal Cough-Schulze worked with the institute’s communications team writing articles for and editing txH2O magazine and TWRI's news section, developing TWRI multimedia materials and editing reports and education and outreach materials. She also served as the managing editor for the Texas Water Journal.